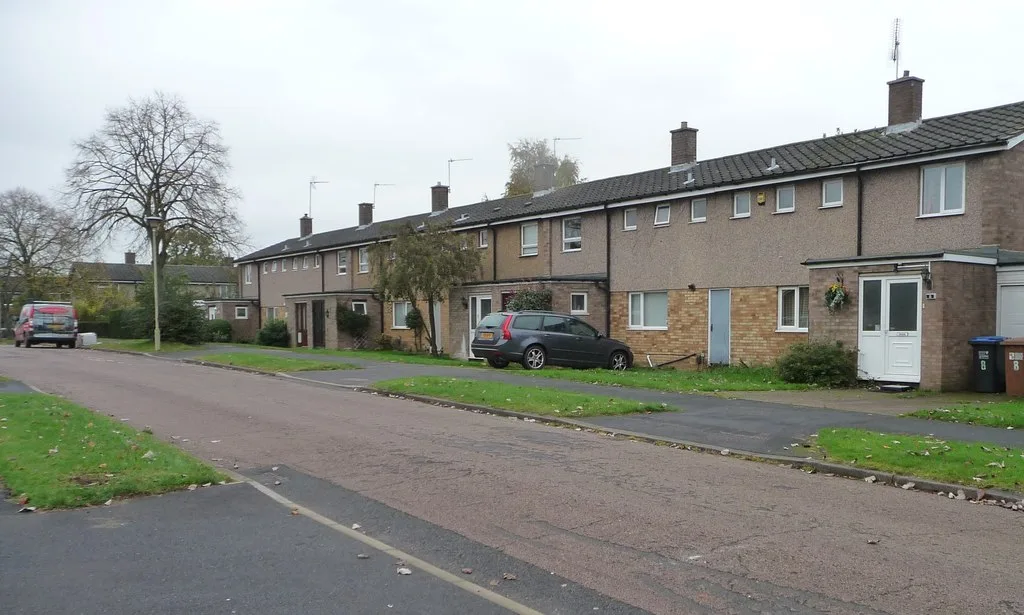

Welwyn Hatfield's average fell to £450,696 in June, the only drop in Hertfordshire. Annual growth is still 5.8%, but prices sit below the August 2022 peak.
The average home in Welwyn Hatfield was worth £450,696 in June, down £4,261 on May. It was the only one of Hertfordshire’s ten districts where prices fell that month.
The figures come from the UK House Price Index, which HM Land Registry published on 19 August. It is the official measure, built from completed sales lodged with the Land Registry rather than from asking prices.
One month is not a trend, and these numbers get revised. But the direction is worth noticing, because for most of this year Welwyn Hatfield has been the fastest-rising district in the county.
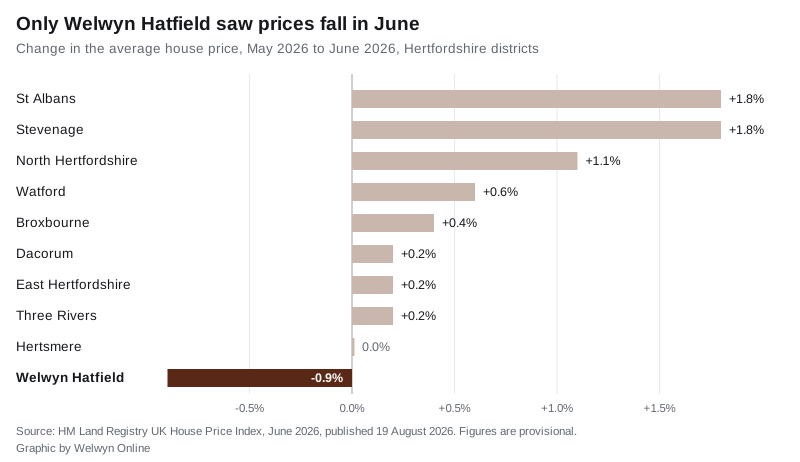
Every other Hertfordshire district held or rose
Welwyn Hatfield fell 0.9% between May and June. Hertsmere was flat. The other eight districts all went up, St Albans and Stevenage by 1.8% each.
Nationally the market barely moved. The UK average was £272,188 in June, up 0.1% on the month.
Over the year, prices are still well up
The one-month dip has not undone the year. Welwyn Hatfield’s average is £24,549 higher than in June 2025, a rise of 5.8%. That is nearly three times the UK’s 2.0%, and comfortably ahead of the Hertfordshire county average of 3.5%.
| Area | Average, June 2026 | Change on the year |
|---|---|---|
| Welwyn Hatfield | £450,696 | +5.8% |
| Hertfordshire | £470,873 | +3.5% |
| East of England | £338,707 | +1.1% |
| England | £293,262 | +1.8% |
| United Kingdom | £272,188 | +2.0% |
What has changed is the ranking. In May, Welwyn Hatfield had the fastest annual growth in Hertfordshire at 6.6%. In June it was overtaken by North Hertfordshire, where prices are now up 7.8% on the year.
Flats are the cheap end, and the slow end
The borough average hides a wide spread. Detached homes, concentrated in villages such as Brookmans Park, Digswell and Essendon, average more than three and a half times what a flat costs.
| Property type | Average, June 2026 | Change on the year |
|---|---|---|
| Detached | £952,108 | +4.2% |
| Semi-detached | £533,527 | +7.1% |
| Terraced | £408,986 | +7.0% |
| Flat or maisonette | £248,002 | +4.0% |
Semi-detached and terraced homes, the two types most first-time buyers and second-steppers actually chase, rose fastest. The first-time buyer average across the borough was £363,714, up 6.1% on the year.
What a home in the borough actually sold for
The index average is not the price of a typical home. It is an average of the whole market, so a handful of very expensive sales pull it upwards.
Across the 12 months to 30 June 2026 there were 906 home sales in the AL7, AL8, AL9 and AL10 postcode districts, according to Land Registry Price Paid records. The median sale, the one in the middle, was £400,000, about £50,000 below the index figure. The split by town is clear:
- Welwyn Garden City (AL7 and AL8): median £410,000
- Hatfield (AL9 and AL10): median £380,000
Our Welwyn Garden City house prices page breaks the same sales down ward by ward, from Peartree to Brookmans Park.
Still short of the 2022 peak
For all the recent growth, the borough has not recovered its record. The highest monthly average the index has ever recorded for Welwyn Hatfield was £462,678 in August 2022. June 2026 is £11,982 below that, four years on.
Why last month’s number moved
The May figure has changed since it was first published. When we built our house prices page on 10 August it read £453,552, an annual rise of 6.2%. The index now puts May at £454,957 and 6.6%.
That is normal, not an error. HM Land Registry says estimates for the most recent months are provisional and “are likely to be updated as more data is incorporated into the index”. Roughly 40% of transactions are available when a month is first estimated, rising to 80% to 85% by later revisions. The same page advises caution when reading price changes in the most recent periods.
June’s 0.9% fall is therefore the earliest, least settled reading in the series. It may soften, or deepen, when the July index lands in September.
What it means for you
If you are selling. The June reading does not mean the market has turned. The year-on-year picture is still one of the strongest in Hertfordshire. It does mean that agents quoting a “borough average” of £450,696 are quoting a mean of the whole market, including £950,000 detached houses in the villages. For most homes in Welwyn Garden City or Hatfield, the £400,000 median is the more useful anchor.
If you are buying. Semi-detached and terraced prices rose 7% over the year, faster than detached or flats. Flats, at an average £248,002, remain the only part of the borough market under £250,000.
If you are worried about your council tax. Nothing here changes a band. Council tax bands in England are still set on what a property was worth on 1 April 1991, not on the price it would fetch today.
If you are watching supply. The borough’s Local Plan and its housing land supply are the medium-term influence on all of this. We track decisions on our Welwyn Hatfield planning news page, and the commute to London is a large part of why this borough prices the way it does.
A note on the numbers
The UK House Price Index average is a geometric mean of the whole market, not a median. It covers the whole Welwyn Hatfield borough, which includes Welwyn Garden City, Hatfield, Welwyn, Digswell, Brookmans Park, Cuffley and Essendon, and it is not a valuation of any individual property. Figures for recent months are provisional.
Sources
- UK House Price Index, Welwyn Hatfield, June 2026, HM Land Registry
- UK House Price Index for June 2026 and its summary, published 19 August 2026
- About the UK House Price Index, on averages and revisions
- Price Paid Data, HM Land Registry, for sales in AL7, AL8, AL9 and AL10 in the year to 30 June 2026
Have your say