
The average Welwyn Hatfield home was £448,681 in July, down £6,075 since April. Annual growth has halved to 3.0%, still twice the UK rate.
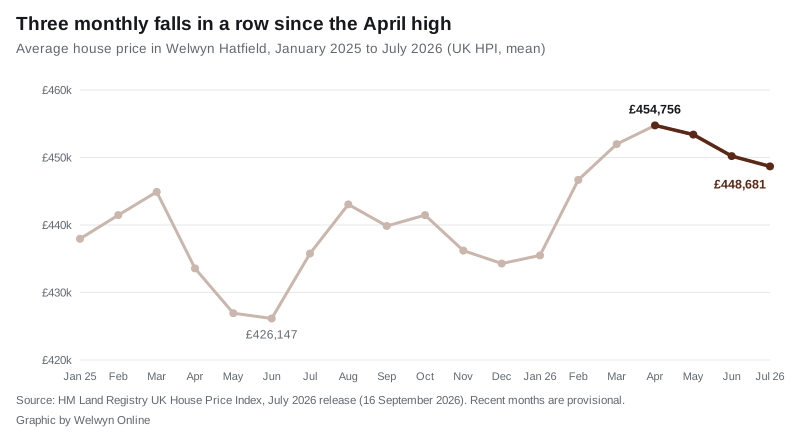
House prices in Welwyn Hatfield fell again in July, the third month in a row. The average home was worth £448,681, down 0.3% on June.
That is £6,075 below April’s £454,756, the highest figure this year. Over the year prices are still up, by 3.0%. But that rate has halved in two months, from 6.2% in May.
The figures come from the UK House Price Index, which HM Land Registry published on Wednesday 16 September. It is built from completed sales lodged with the Land Registry, not asking prices.
The month-by-month slide
Each fall has been small. Together they have taken back a chunk of the spring rise.
| Month | Average price | Change on the month |
|---|---|---|
| April 2026 | £454,756 | +0.6% |
| May 2026 | £453,398 | -0.3% |
| June 2026 | £450,210 | -0.7% |
| July 2026 | £448,681 | -0.3% |
The last time the borough had three falls in a row was April to June 2025. Prices then bottomed out at £426,147 before recovering.
Why the annual figure halved
Most of the drop in annual growth is not about this summer. It is about last summer.
In July 2025 Welwyn Hatfield’s average jumped 2.3% in a single month, from £426,147 to £435,781. July 2026 is being measured against that higher starting point. So even a modest 0.3% dip this July knocks the annual rate down sharply, from 5.6% in June to 3.0%.
In pounds, the average home is £12,900 dearer than a year ago.
How the rest of Hertfordshire did
Five of the county’s ten districts fell in July and five rose. The big fallers were Hertsmere and Stevenage, both down more than 2% in a month.
| District | Average, July 2026 | Change on the month | Change on the year |
|---|---|---|---|
| St Albans | £646,781 | -0.1% | +2.3% |
| Three Rivers | £590,816 | +2.6% | +2.3% |
| Hertsmere | £548,704 | -2.4% | +1.3% |
| Dacorum | £459,235 | +0.2% | +3.0% |
| East Hertfordshire | £457,417 | -0.2% | +3.7% |
| Welwyn Hatfield | £448,681 | -0.3% | +3.0% |
| North Hertfordshire | £418,857 | +0.2% | +5.3% |
| Broxbourne | £411,689 | +1.3% | +2.5% |
| Watford | £404,299 | +2.1% | -0.7% |
| Stevenage | £316,210 | -2.2% | +1.8% |
On annual growth, Welwyn Hatfield is joint third in the county with Dacorum. Only North Hertfordshire and East Hertfordshire are rising faster.
The Hertfordshire average was £469,474, up 2.7% on the year. Across the UK the average was £273,000, up 1.4% on the year and 0.7% on the month. So the borough is still growing at more than twice the national rate, but it is now moving the other way month to month.
Among all 295 English council areas, Welwyn Hatfield ranked 97th for annual growth. In July, 126 of them saw prices fall on the month.
By type of home
| Property type | Average, July 2026 | Change on the year |
|---|---|---|
| Detached | £952,331 | +3.1% |
| Semi-detached | £530,661 | +4.3% |
| Terraced | £407,970 | +3.8% |
| Flat or maisonette | £245,354 | +0.2% |
Flats have almost stopped rising. They are up just 0.2% on a year ago. Semi-detached homes are still the strongest part of the market.
The first-time buyer average was £361,519, up 2.9% on the year.
Last month’s figures have moved
Land Registry revises recent months as more sales come in. Our June report used the figures published in August. With the July release:
- June has been revised from £450,696 to £450,210, and its monthly fall from 0.9% to 0.7%
- May has been revised from £454,957 to £453,398
- April, at £454,756, is now the highest month of 2026
The official guidance says estimates for the latest months are provisional and “are likely to be updated as more data is incorporated into the index”. July’s figure will move too.
Still below the 2022 record
The borough’s highest recorded average is £462,678, in August 2022. July 2026 is £13,997 short of it.
What it means for you
If you are selling. Three small falls do not make a crash, and prices are still higher than a year ago. But the spring high has passed. A valuation based on what homes fetched in April may now be a little optimistic.
If you are buying. Flats have barely moved in a year, at an average of £245,354. Semi-detached homes have risen fastest, at 4.3%.
If you want street-level prices. The index average is a mean of the whole borough, pulled up by expensive detached homes in the villages. Our Welwyn Garden City house prices page breaks actual sale prices down by area.
Your council tax does not change. Bands in England are still based on what a home was worth on 1 April 1991. Our council tax bands page has this year’s charges.
A note on the numbers
The UK House Price Index average is a mean across the whole market, not a median. It covers the whole of Welwyn Hatfield borough, including Welwyn Garden City, Hatfield, Welwyn, Brookmans Park, Cuffley and the villages. It is not a valuation of any single home.
Sources
- UK House Price Index for July 2026 and the July 2026 summary, HM Land Registry, published 16 September 2026
- UK HPI full data file, July 2026, for every Hertfordshire district, the ranking against 295 English council areas, the monthly series and the revised May and June figures
- UK House Price Index, Welwyn Hatfield, HM Land Registry
- About the UK House Price Index, on revisions
Have your say